


Hi friends,
More than 2 million people use Glasp to highlight what they read. Among them are PhD students, researchers, clinicians, medical students and people in mathematics and the sciences. Most of what people highlight is articles, newsletters and blog posts. But a part of it is research papers, and we wanted to know who reads them, and which papers.
So we took every research paper we could identify among the pages highlighted on Glasp over 90 days (late July to late October 2026), found the field of each one using OpenAlex, the open index of scholarly work, and compared the mix with the papers the world published in 2024.
Here is what came out. Throughout, “the world” means every research paper published in 2024 that OpenAlex has classified, and “4.4x” means a field’s share among Glasp paper readers is 4.4 times its share of those papers.
If you want to reread or highlight this newsletter, save it to Glasp.
The short version
Medicine and health lead. About 39% of the people who highlighted a paper on Glasp read at least one paper in medicine, nursing, health professions or dentistry. Those fields are 19.5% of the world’s papers. That is about 2x.
Neuroscience is the biggest outlier. Neuroscience is a small slice of the world’s 2024 papers, but its share among Glasp paper readers is about 4.4 times that slice. Psychology follows at 2.3 times.
Engineering, the arts and humanities, agriculture and materials science are well below their share of the world’s papers: about 0.4 to 0.6 times.
Computer science, economics and environmental science sit close to the world’s mix, around 1x.
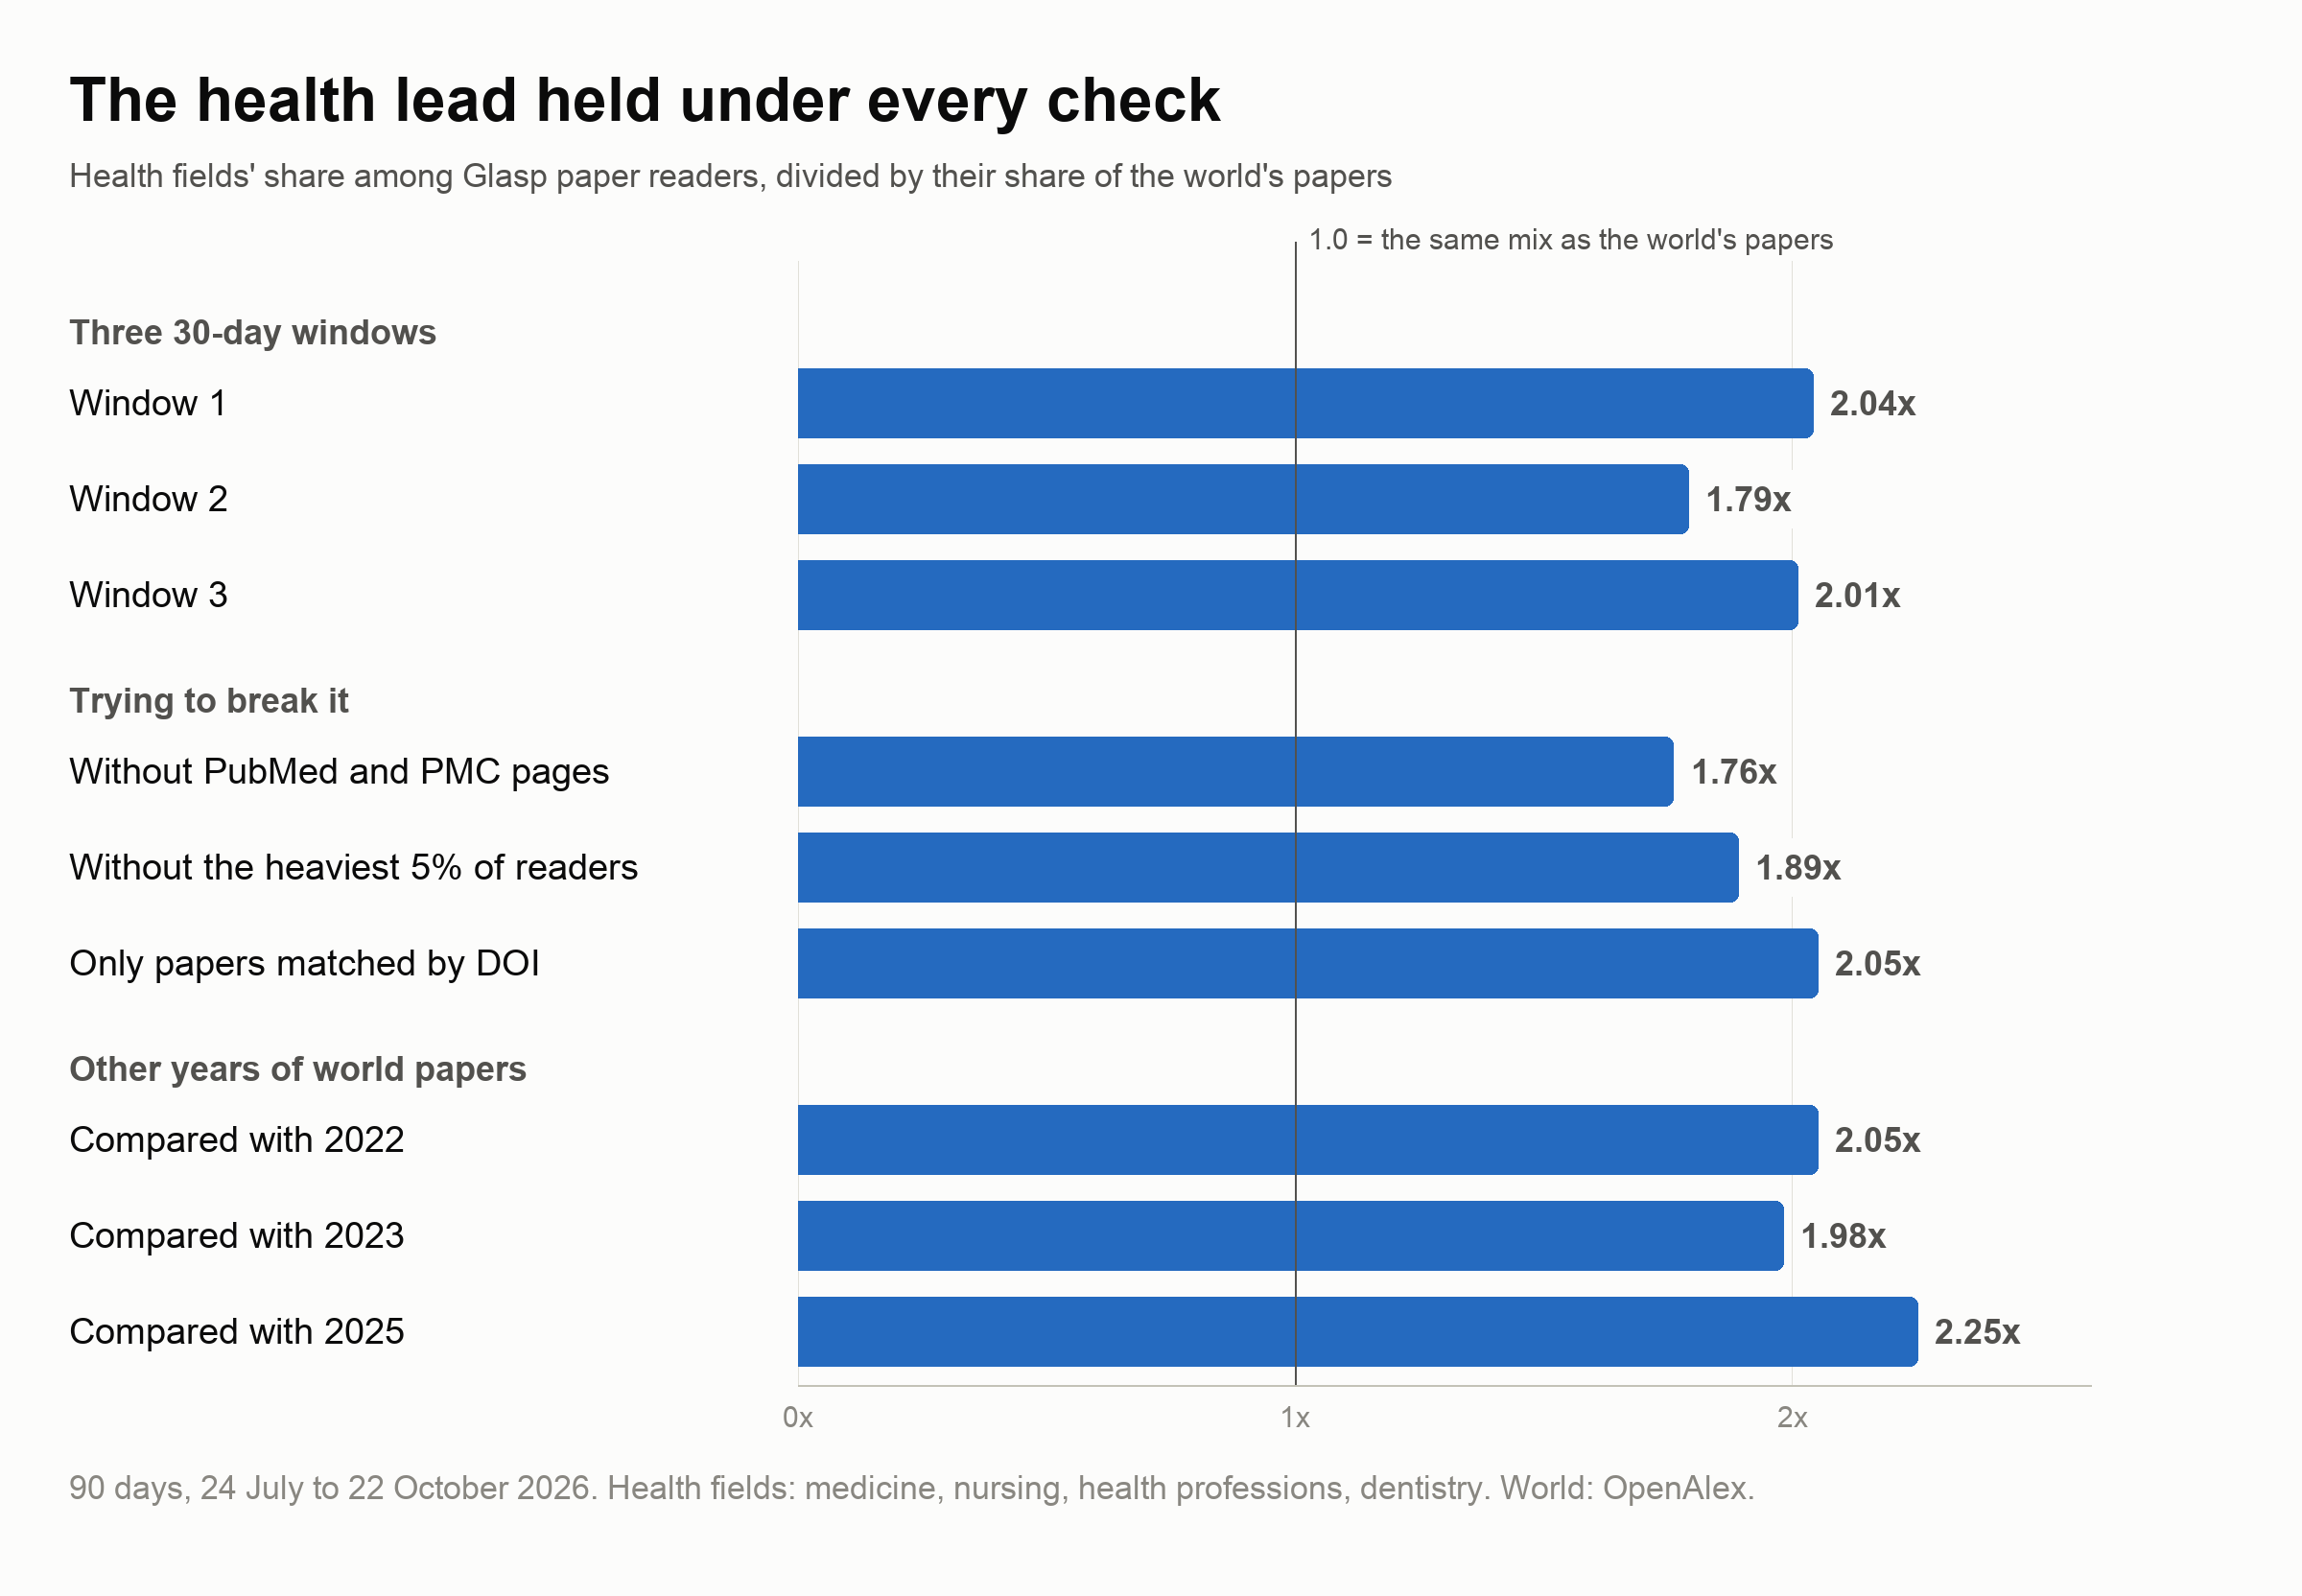
The shape held across all three 30-day windows in the period. The medical ratio was 2.04x, 1.79x and 2.01x.
All 13 fields
How to read it: a ratio of 2.0 means that field’s share among Glasp paper readers is twice its share of the world’s papers in 2024. A ratio of 1.0 means Glasp readers match the world. Below 1 means fewer than you would expect.
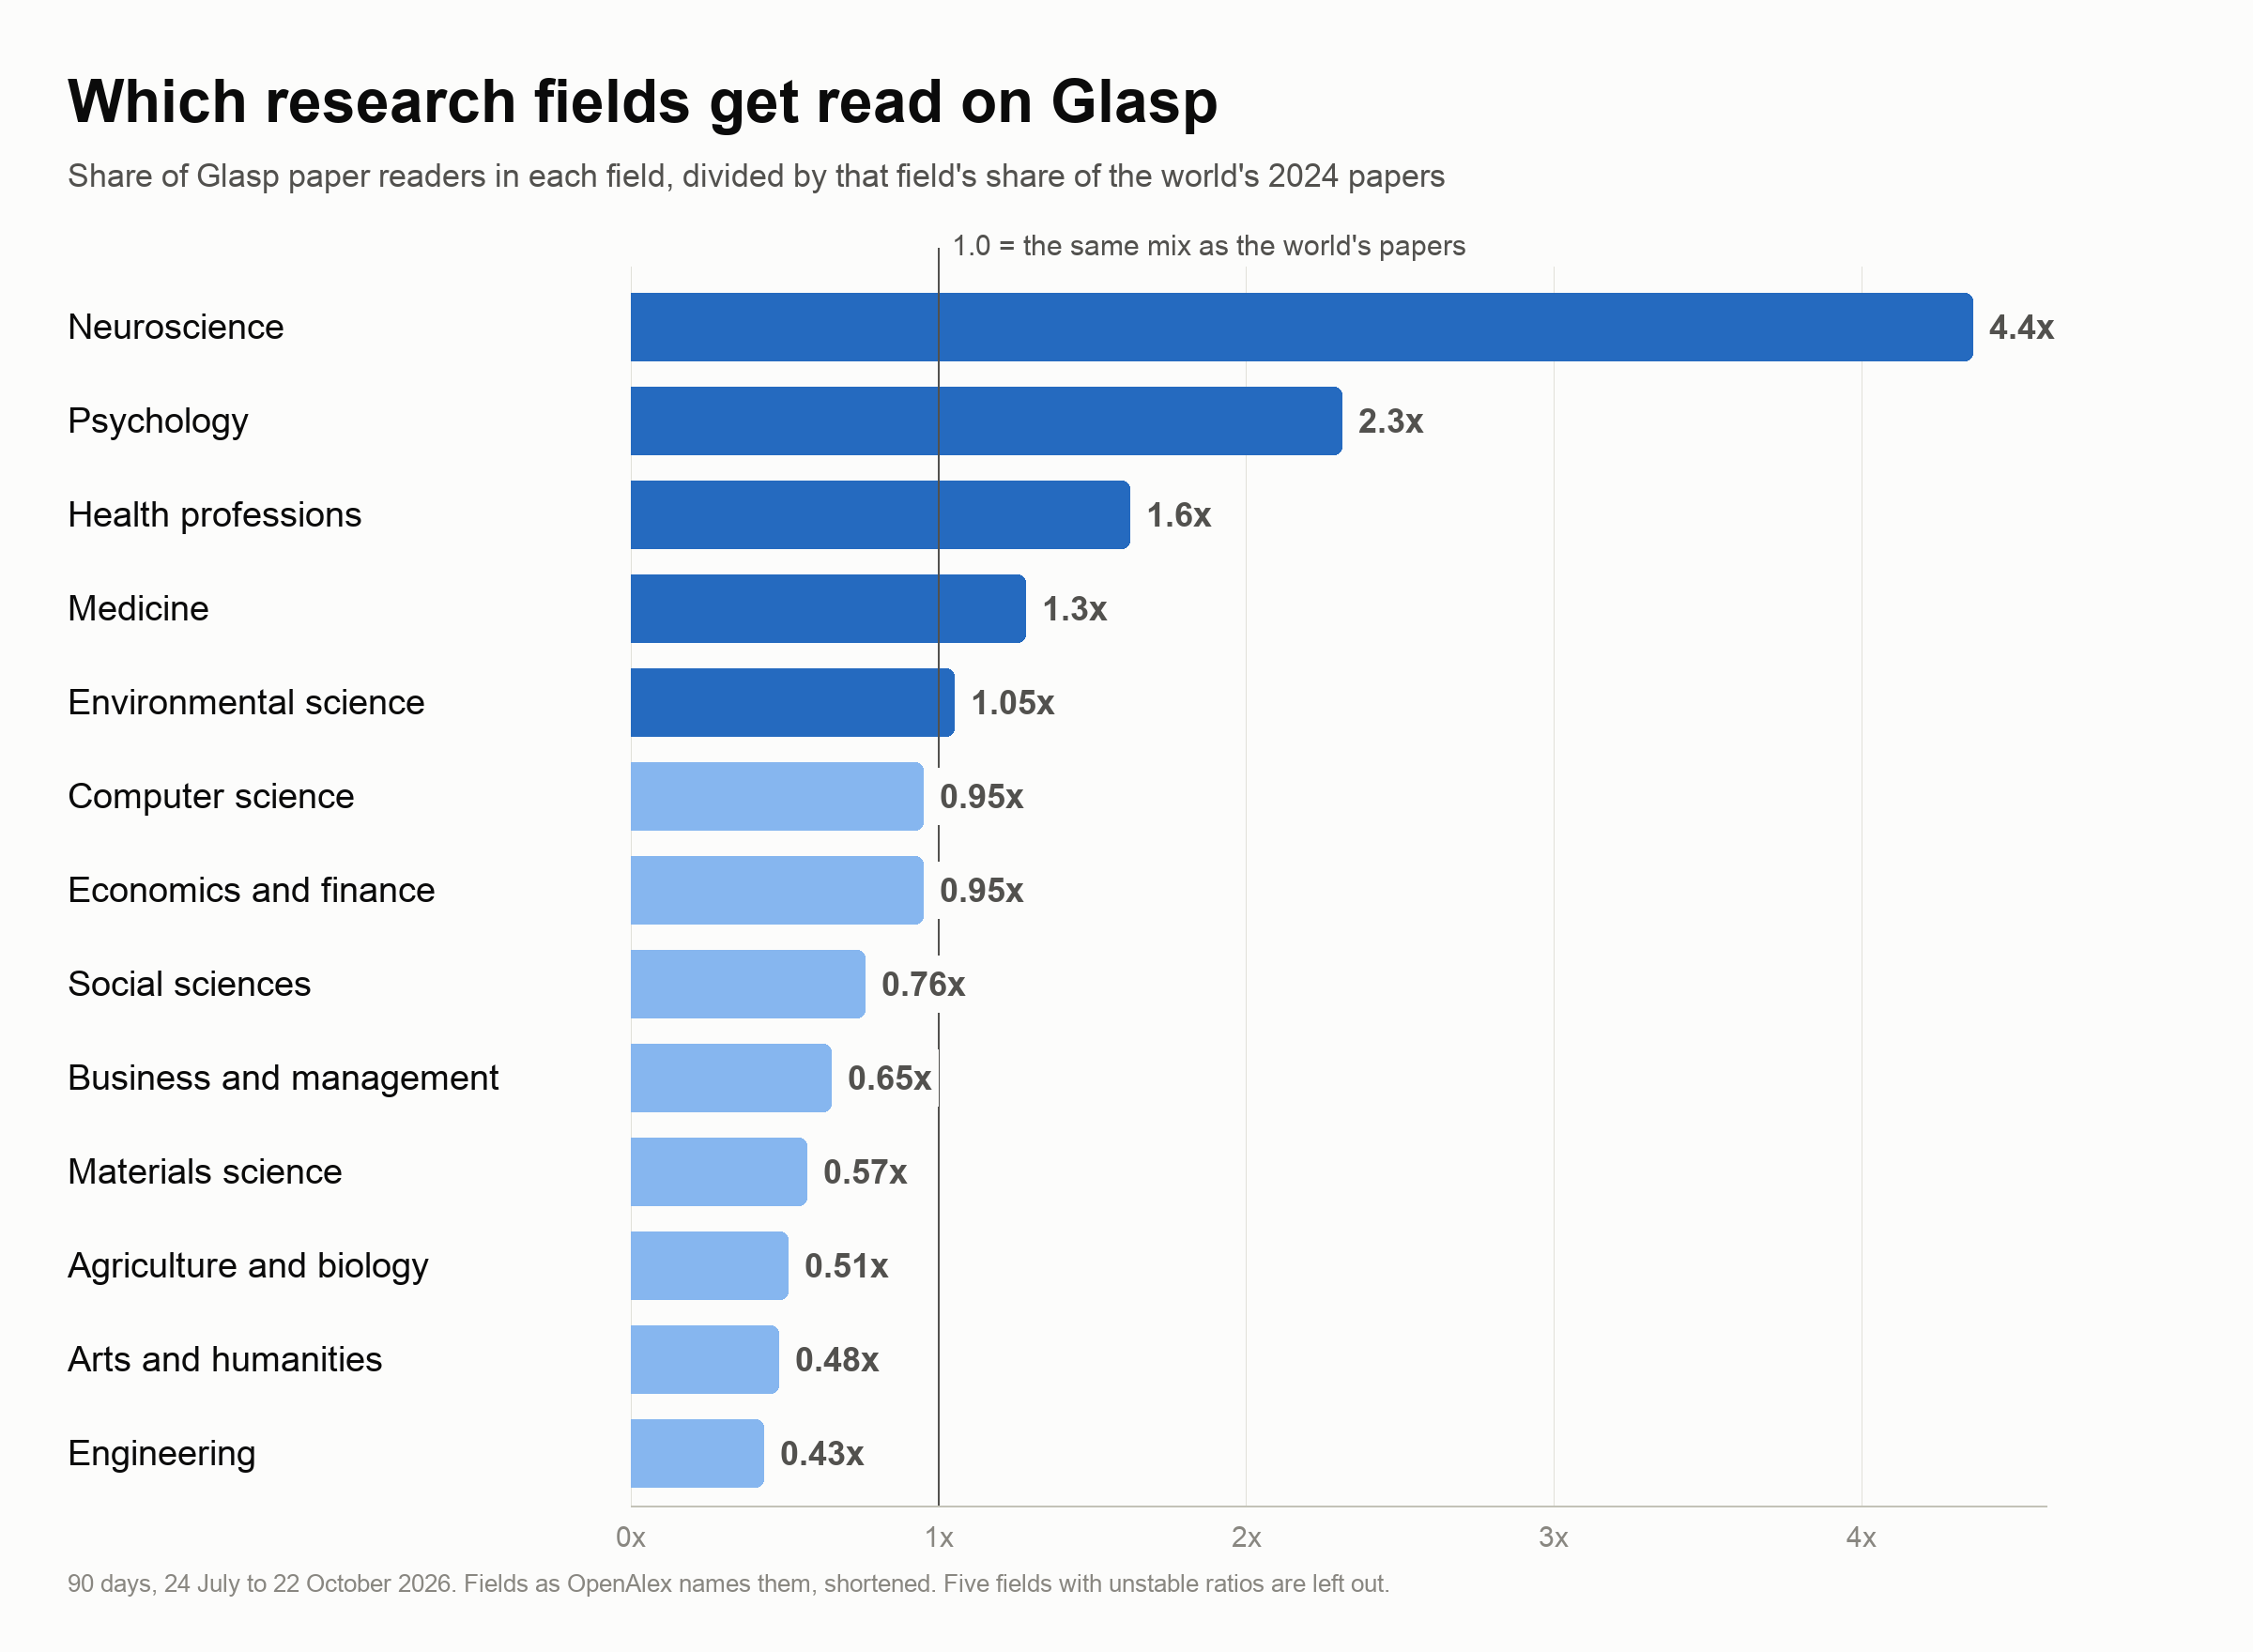
Medicine on its own is 1.3x. Medicine is already the largest field in the world's output, so even a modest ratio means it is the field our paper readers meet most often. The 2x figure above is for the four health fields together.
What this tells us (we think)
The people who highlight papers on Glasp lean toward the life and mind sciences: how the brain works, how people behave, how to care for patients. These are fields where reading is close to practice. A nurse or a clinician reads to decide what to do on Monday. A psychology student reads, and then has to explain it in their own words.
It also fits what we hear from users: students preparing for medical exams, researchers keeping track of a fast literature, people who read on the web and want their notes in one place.
Why these fields? Three numbers side by side
A field can show up a lot on Glasp for three different reasons: there are many students in it, it publishes many papers, or its people read a lot. So we put our number next to the other two.
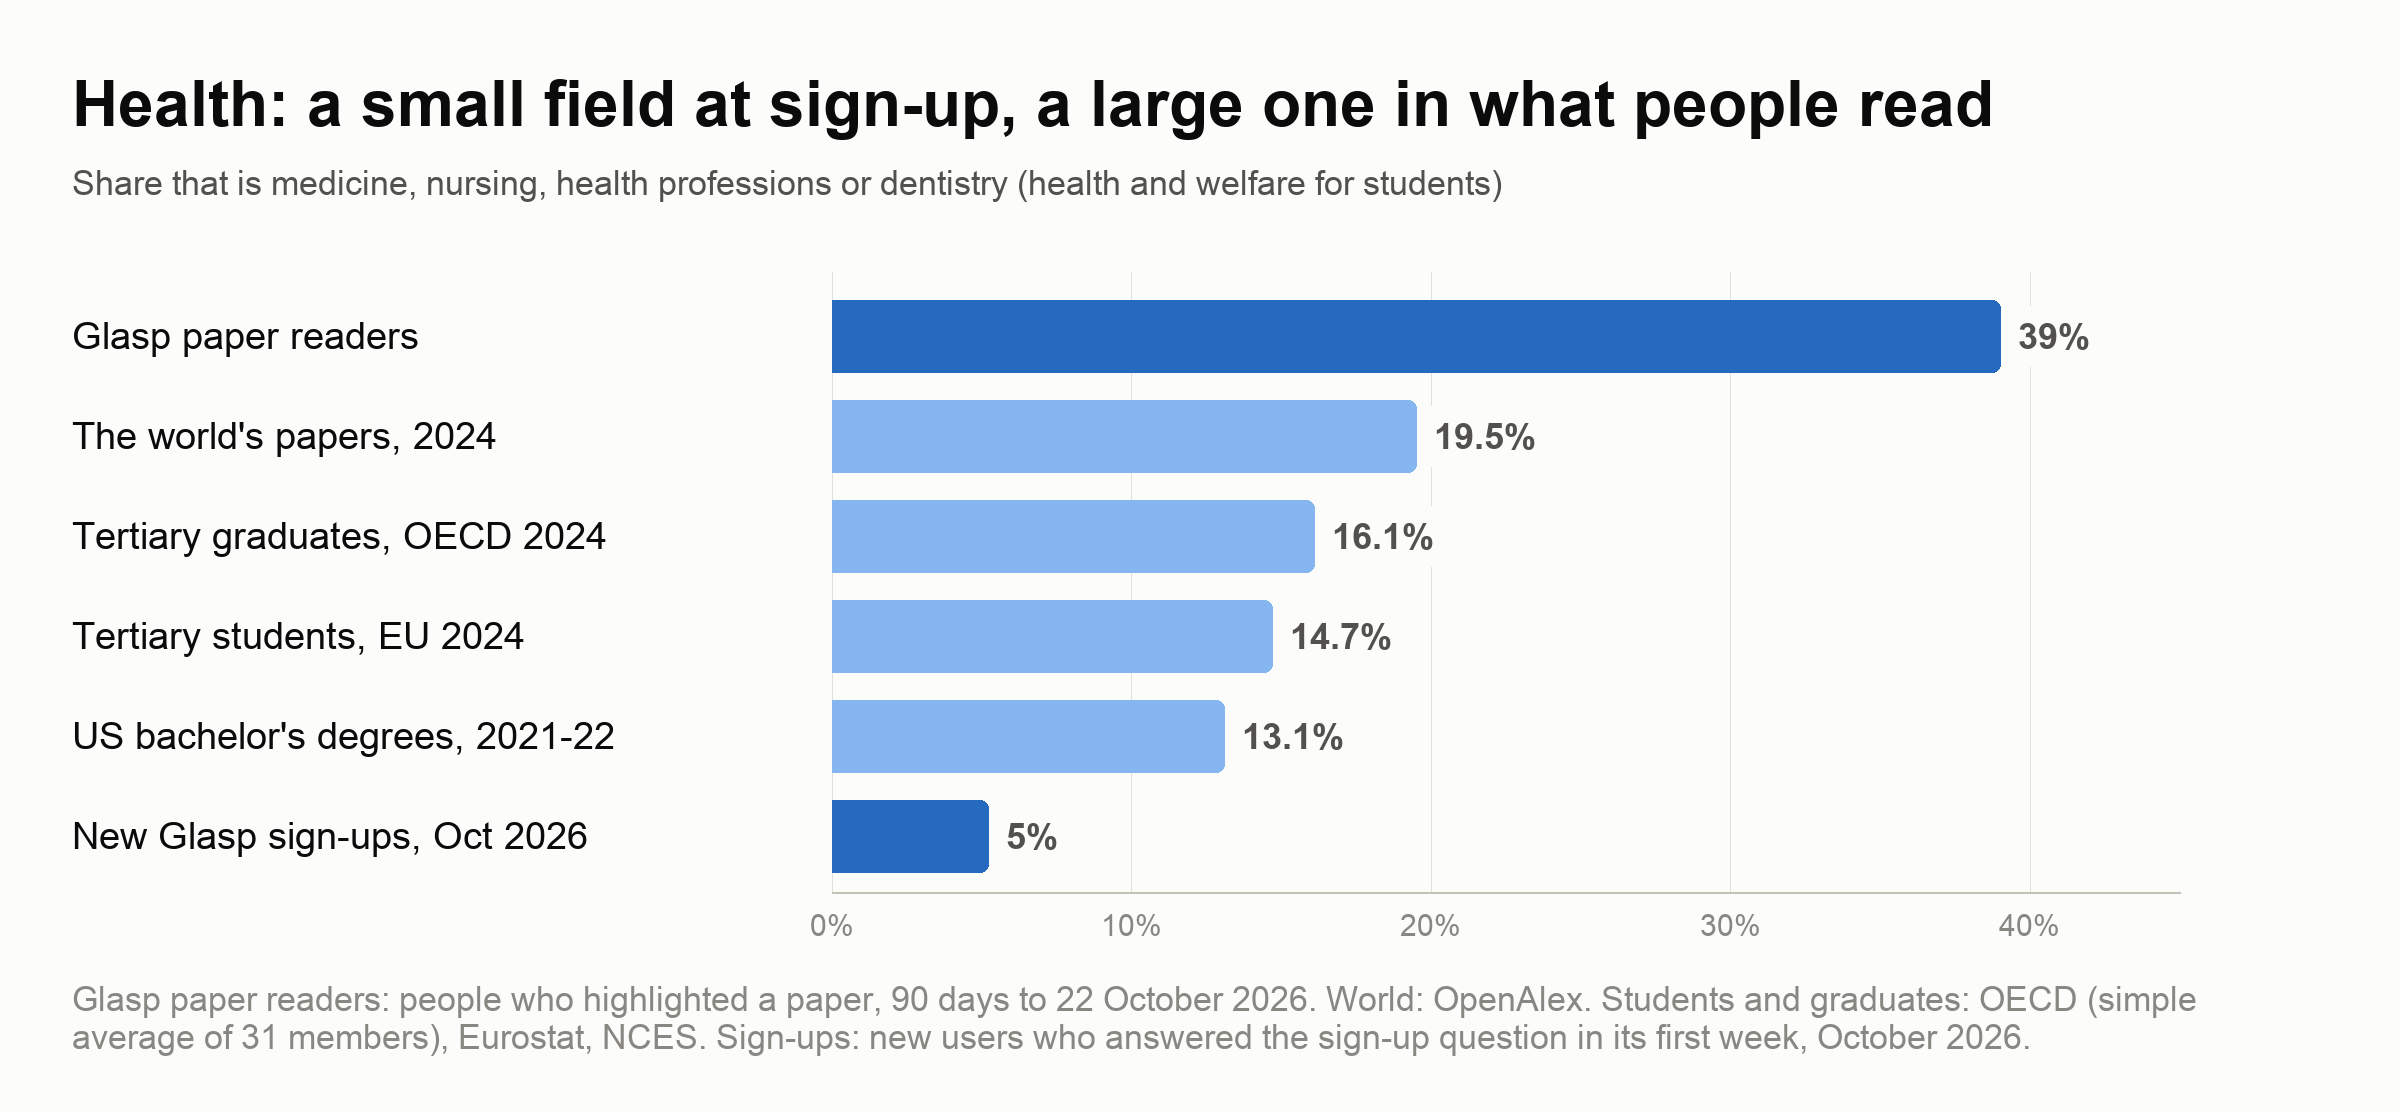
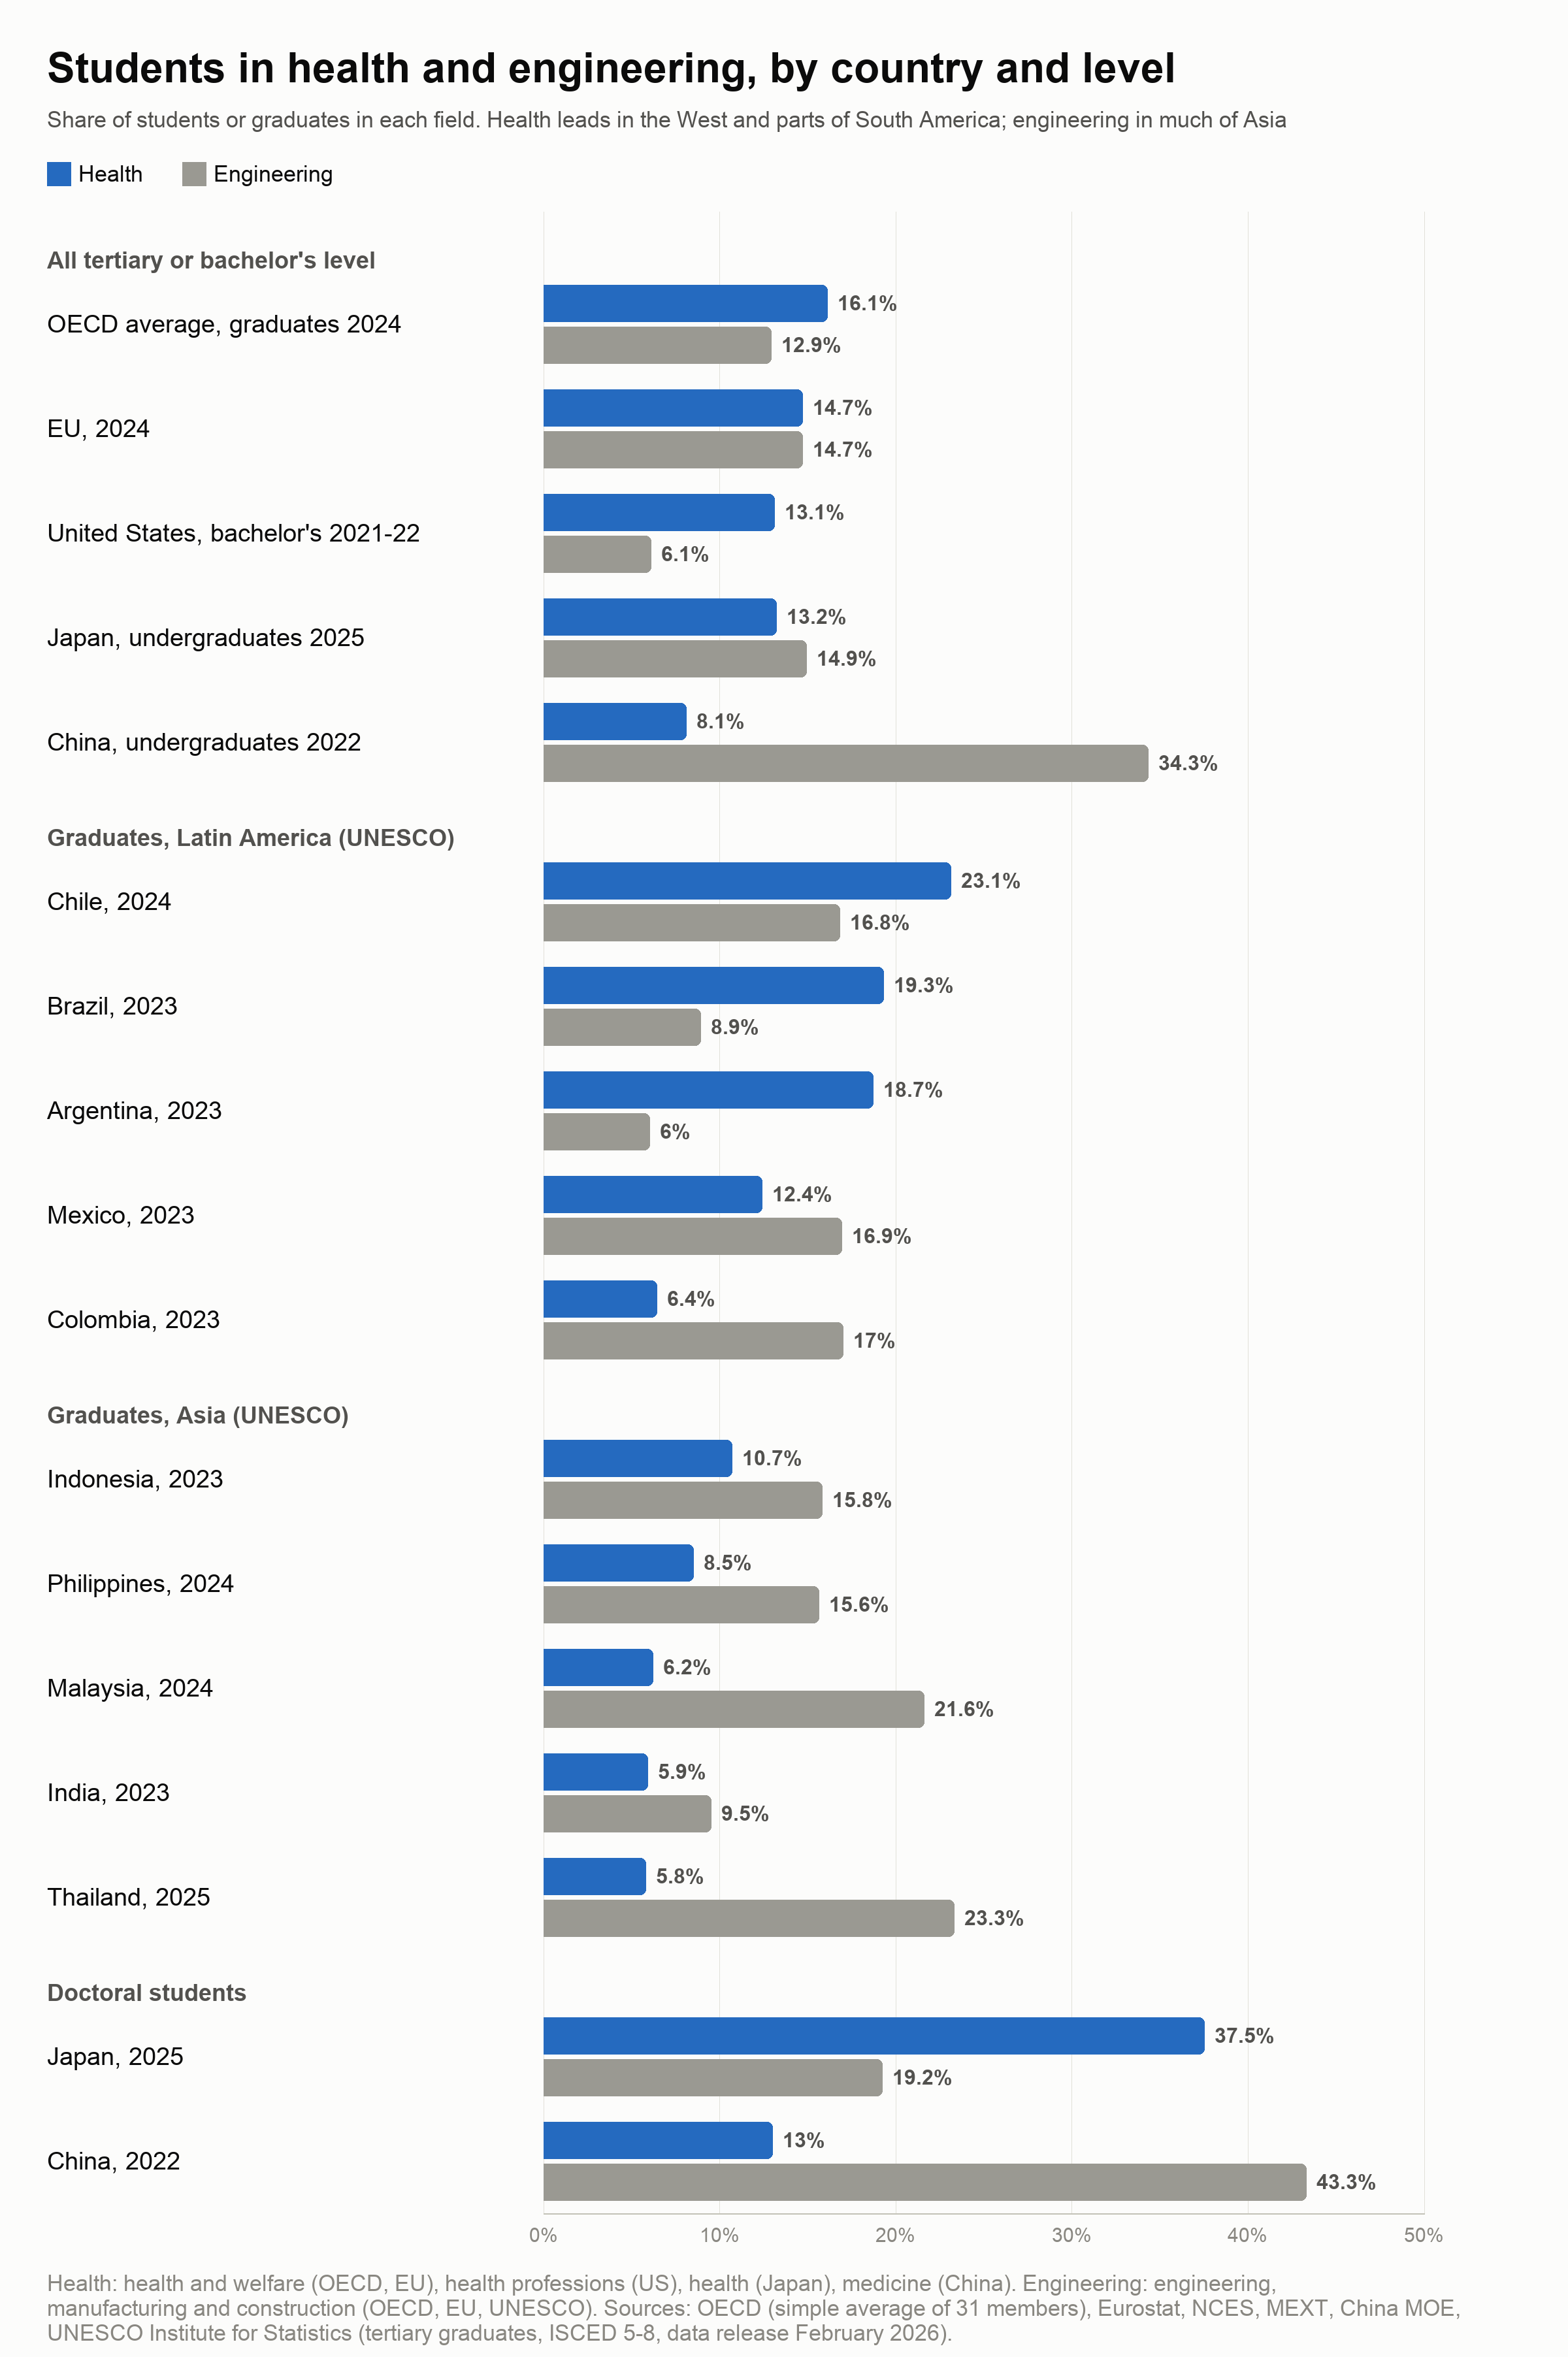
Sources for the student bars: US bachelor’s degrees 2021-22 (NCES): health professions 13.1%, engineering 6.1%. EU tertiary students 2024 (Eurostat): health and welfare 14.7%, engineering, manufacturing and construction 14.7%. OECD countries 2024 (tertiary graduates, simple average of 31 members): health and welfare 16.1%, engineering 12.9%. The US, OECD and UNESCO figures count graduates; the EU, Japan and China figures count enrolled students. UNESCO: UIS, tertiary graduates (ISCED 5-8), February 2026 release.
Health is not large everywhere. It is 13% to 23% of students or graduates in the OECD average, the EU, the US, Japan, Chile, Brazil and Argentina. Engineering leads instead in China (34% of undergraduates, 43% of doctoral students), Mexico, Colombia and the Asian countries we checked (Indonesia, the Philippines, Malaysia, India and Thailand), where health is about 6% to 12%. And health grows at the doctoral level: in Japan it is 37.5% of doctoral students.
So health is over-represented on Glasp against both papers and students. Here is what we think explains it, from the most to the least certain.
Paper readers are probably not average students. We have not measured who our paper readers are, but paper reading usually leans toward graduate students, researchers and clinicians, and health is unusually large at that level. In Japan, for example, health is about 13% of undergraduates but about 37% of doctoral students (MEXT, 2025).
Medicine readers read more papers each. In this 90-day measurement, medicine’s ratio counted in papers (1.86x) is about 1.5 times its ratio counted in people (1.28x): each medicine reader highlighted more medicine papers than the typical reader did in their own field. (Outside surveys of academics disagree on which field reads the most, so we only report what we measured.)
Medical papers are easy to open in a browser. PubMed Central gives free full text on the web. Taking those pages out moves our health number from 2.0x to about 1.8x. So the lead does not depend on those pages, though this check cannot say how much easy access adds.
Engineering is the mirror image. It has plenty of students and papers. Its low ratio may mean fewer engineers on Glasp, or reading habits (PDFs, conference papers) that this measurement captures less well. We cannot yet tell “fewer engineers” from “engineers we cannot see.”
Who is reading
Where they read from. About 45% of the people who highlight research papers on Glasp use it in US English, and about two in three use it in English (browser language, the same 90 days).
What they studied. Since mid-October, the sign-up form asks new users what field they work or study in and their highest degree, with “prefer not to say” as a choice. Of the new users who answered in their first week (leaving out “prefer not to say” and “undeclared”):
About 1 in 5 hold a graduate or professional degree: 14% a master’s, 4% a doctorate, 3% a professional degree such as an MD or a JD.
About 1 in 8 work or study in medicine and health, the life sciences, mathematics, physics or chemistry. Medicine and health alone is 5%.
Software, data and AI together are about a quarter, and engineering another 6%.
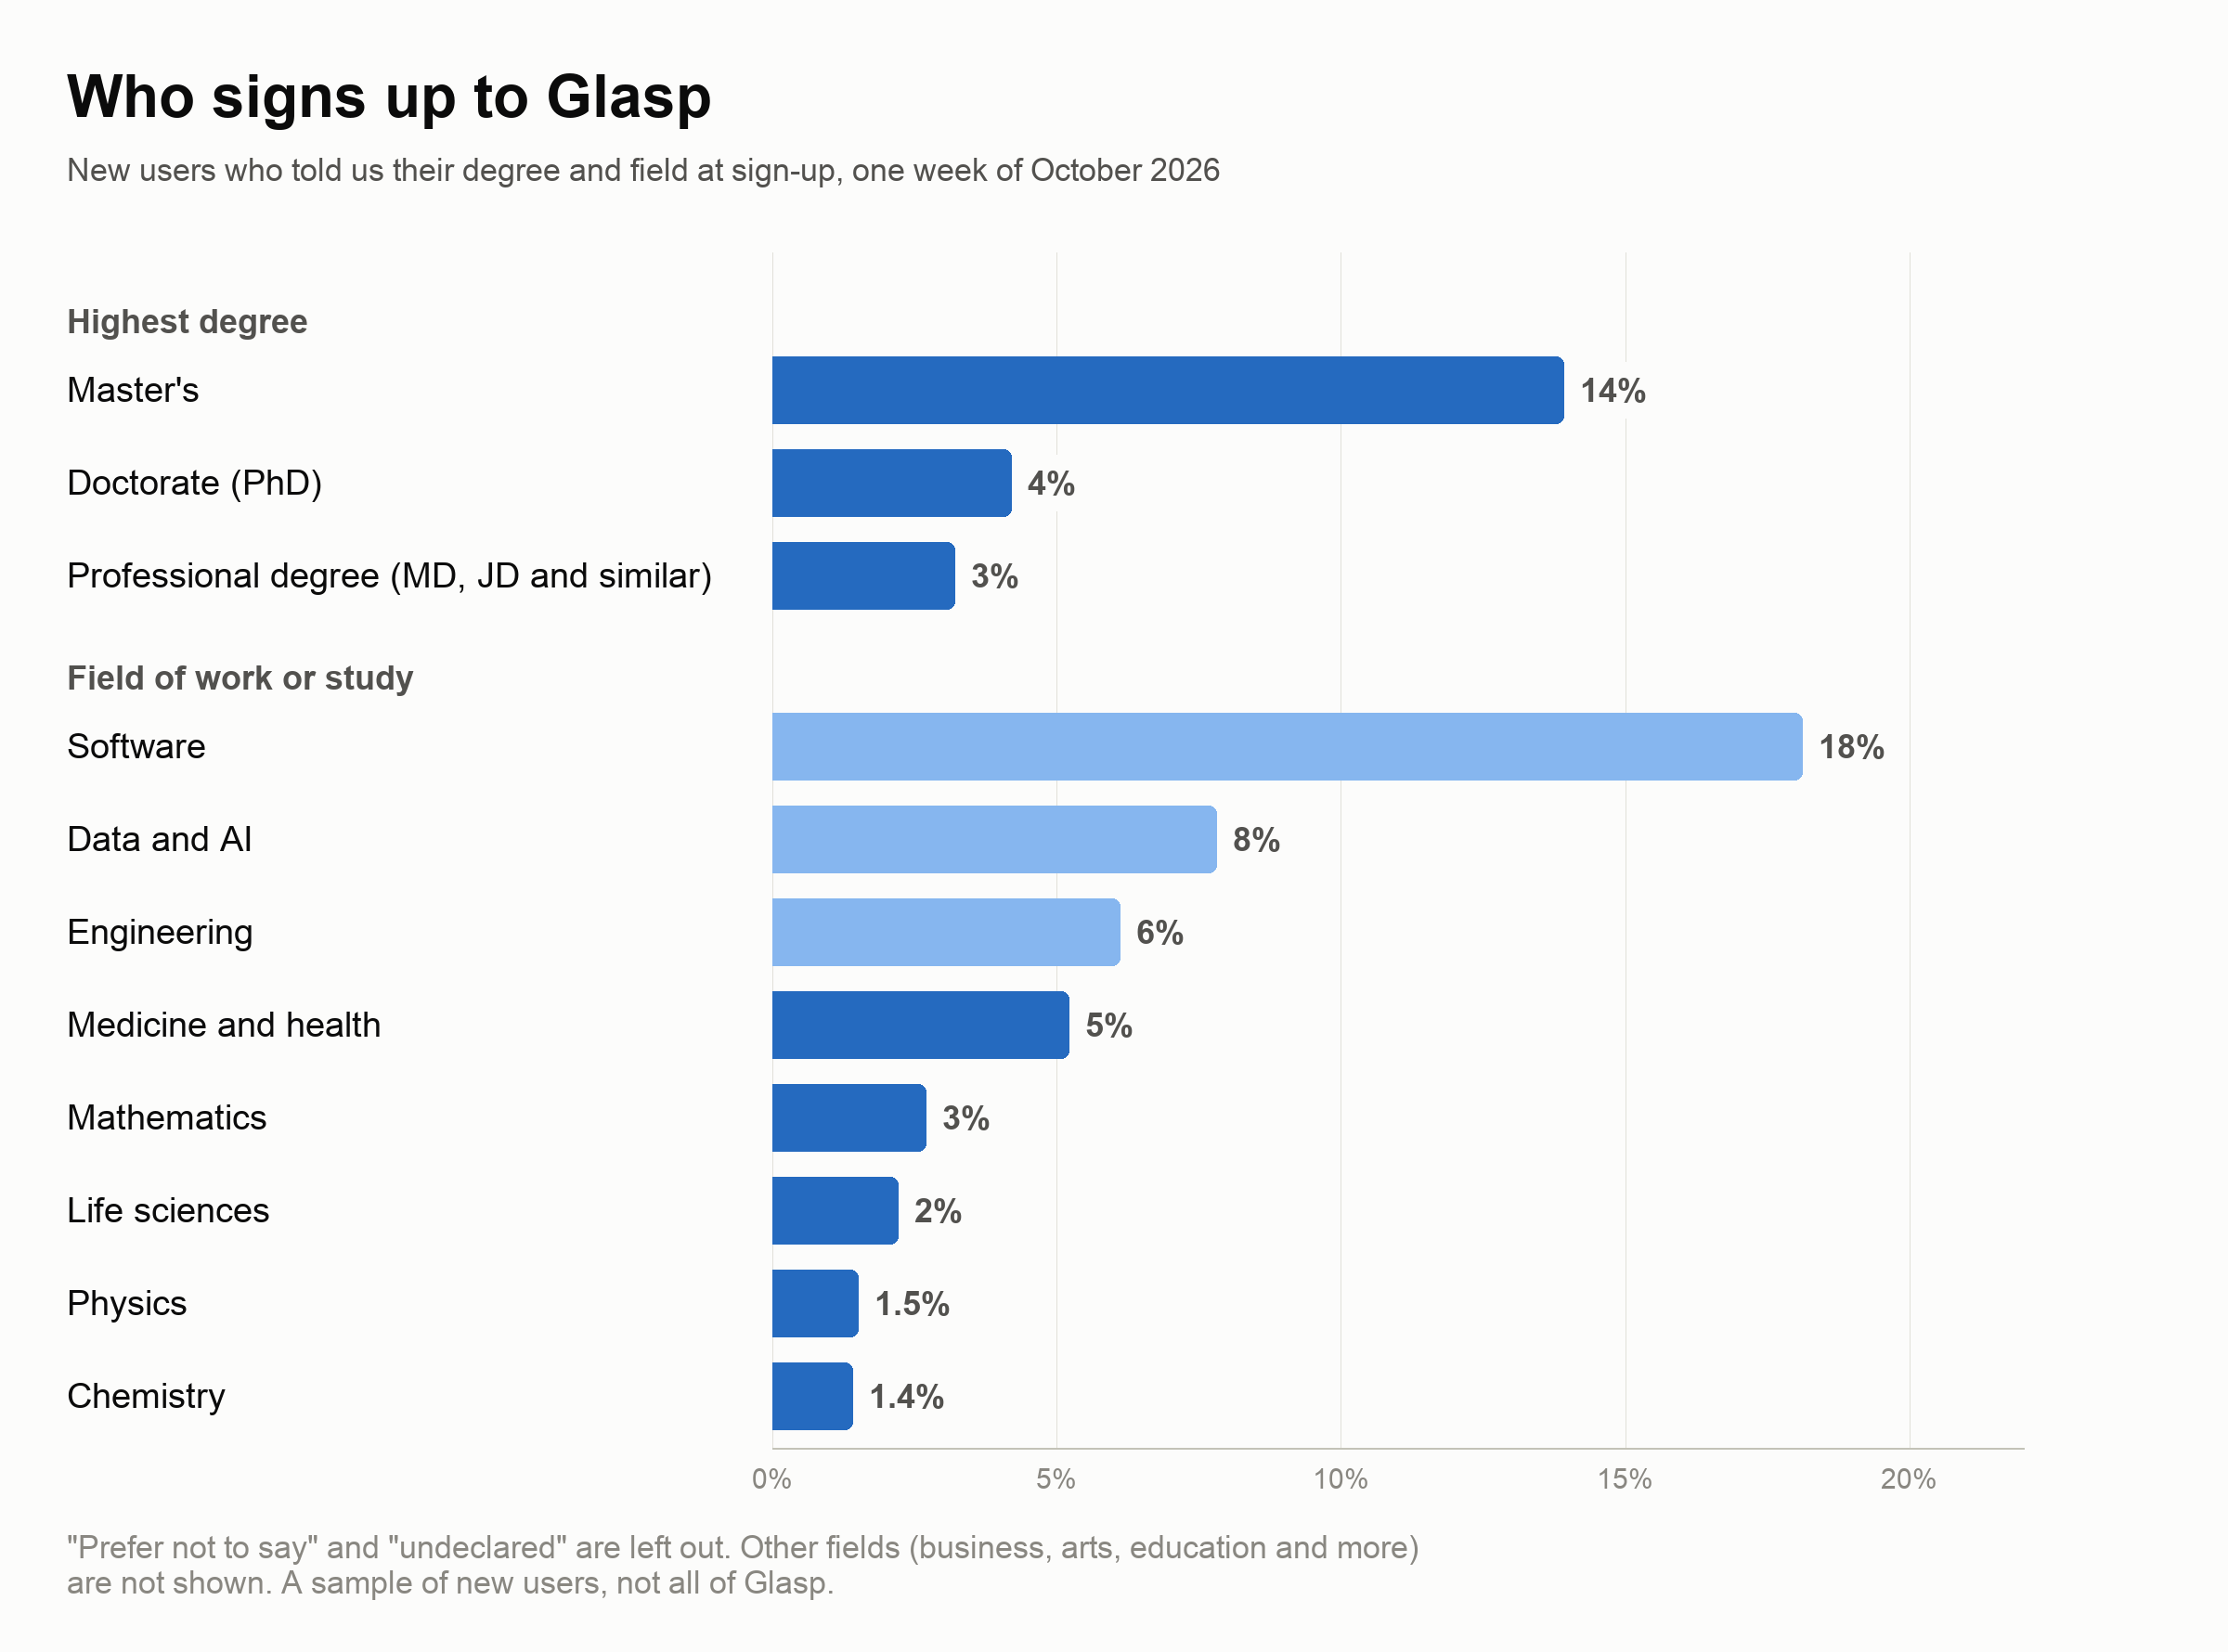
Put that next to the paper numbers above. Only about 5% of new users name medicine and health as their field, yet about 39% of the people who highlight papers read at least one health paper. The two are counted differently (one field per person at sign-up, any paper read over 90 days), so read them as a contrast, not a ratio. The sign-up answers are a separate group, so they do not tell us the fields of the paper readers themselves.
What this does not tell us
The ratio is useful, and it has limits. Here are the ones we know about.
It counts people, not papers. A field’s share is the number of people who highlighted at least one paper in it. One person who reads in two fields counts in both. The world’s side is counted in papers, because that is what exists. So the ratio compares who reads, not how much.
We can only see papers read in the browser. Glasp highlights web pages. Fields where people mostly read PDFs (many engineering, physics and math papers, much of arXiv) are harder for us to see. So “engineering 0.43x” may mean fewer engineers, or engineers reading in a way we do not capture. We cannot tell these apart yet.
Some fields are easier to read on the web. Medicine has a large free full-text library online (PubMed Central). When we removed all PubMed and PubMed Central pages, the medical ratio fell from 2.0x to about 1.8x. Part of the lead is ease of access. Most of it stays.
Papers are a small part of how Glasp is used. This is a picture of the people on Glasp who read papers, not of Glasp’s users as a whole.
Small fields move around, so some are not in the chart. Fields with too few readers to measure are left out. So are five we measured but will not put a number on: nursing and immunology, whose ranges are wide enough that we could write “2x” or “4x” and be equally honest; biochemistry and genetics, whose ratio changed from 1.1x to 2.5x depending on which year of world papers we compared with; and chemistry and decision sciences, where we have no range at all. Nursing is still inside the health group in the first bullet, because that group’s 2x held in every window we looked at even though nursing’s own number does not hold still.
We cannot yet say who reads more per person. We also compared how much new users highlight in their first 14 days by the field and degree they gave at sign-up. The differences we saw are within the noise: the ranges are wide and almost all of them include no difference at all, including PhDs against bachelor’s degrees. We will run it again once more people have a full month on Glasp.
How we checked it
Before trusting the result, we tried to break it in four ways:
Remove PubMed and PubMed Central pages: the medical ratio fell to 1.76x. The broad pattern remained.
Remove the heaviest readers (the top 5%, who read the most papers): medical 1.89x. The broad pattern remained.
Keep only papers classified by their identifier (DOI and similar), not by title match: medical 2.05x. The broad pattern remained.
Compare with other years of world papers (2022, 2023, 2025 instead of 2024): medical 2.05x, 1.98x and 2.25x; neuroscience 4.5x to 4.6x; psychology about 2.4x; engineering about 0.47x. These did not move. Biochemistry did, which is why it is not in the chart.
If you read papers, five ways to get more from Glasp
The numbers above come from what people highlight while they read. If your field is one of the quiet ones in the chart, or you mostly read PDFs, these guides are for you.
Read PDFs in the browser and highlight them. Glasp works on PDFs opened in Chrome, so the papers you read as PDFs can live next to everything else.
Keep track of every paper you read. One place for what you read, what you marked, and what you thought about it.
Read a hard paper with AI next to it. Ask about a method or a term without leaving the page, then keep the answer with your highlights.
Studying for a medical exam? Medicine and health lead the chart, so this one is for you: turn what you highlighted into a review.
Learn from research talks too. Many papers come with a talk on YouTube. You can highlight the transcript the same way.
Your turn
Does this match your field? If you read papers on Glasp, hit reply and tell us what you read, and what would make Glasp better for it. We read every reply.
Best,
Kei & Kazuki
Would you like to take Glasp on the go?
With the Glasp mobile app, you can highlight and organize your favorite content anytime, anywhere. Stay productive on the move and never miss an insightful quote.
Partner With Glasp
We currently offer newsletter sponsorships. If you have a product, event, or service you’d like to share with our community of learning enthusiasts, sponsor an edition of our newsletter to reach engaged readers.